 ChatGPT
 Perplexity
 Claude
 Gemini
 Grok
Monitoring Well Data Near a Big New Pumper: What to Watch
The aquifer is the one part of a water system that cannot be replaced. Pumps, motors, and electrical controls get swapped out when they fail or age out, because mechanical equipment comes with predictable failure points. The groundwater resource itself is different.
“Water level is everything to a district manager.” ~ Jim Blair, NightOwl Monitoring Co-founder
Reliable monitoring well data is the only way to understand how a specific formation responds to large withdrawals and changing conditions over time.
“If a water level drops, we don’t have the option to just order another aquifer. In most cases, we don’t have the option to drill to another production zone. You have to work with what the ground can give you.” ~ Jim Blair, NightOwl Monitoring Co-founder
When a high-capacity user starts pulling water from the ground, the surrounding water table reacts. Jim Blair has spent decades watching those changes in the field at BeeCave Drilling, which helped develop NightOwl Monitoring to capture them accurately and give districts a sound basis for permitting decisions.
In This Article
-
Key Takeaways
-
Analyzing a New High-Capacity User
-
Why Hourly Monitoring Well Data Matters
-
Combining Flow Data with Water Levels
-
What Districts Should Track Near a New High-Capacity Well
-
The Bottom Line
-
Frequently Asked Questions
Key Takeaways
-
Hourly water level readings from a nearby monitoring well show drawdown as it happens, including each pump cycle and the recovery after it.
-
Monthly readings miss the peak stress of heavy irrigation hours.
-
Pairing flow data from the production well with water levels links cause (gallons pumped) to effect (feet of drawdown).
-
Together, the two give a district verifiable numbers for permit decisions.
Analyzing a New High-Capacity User
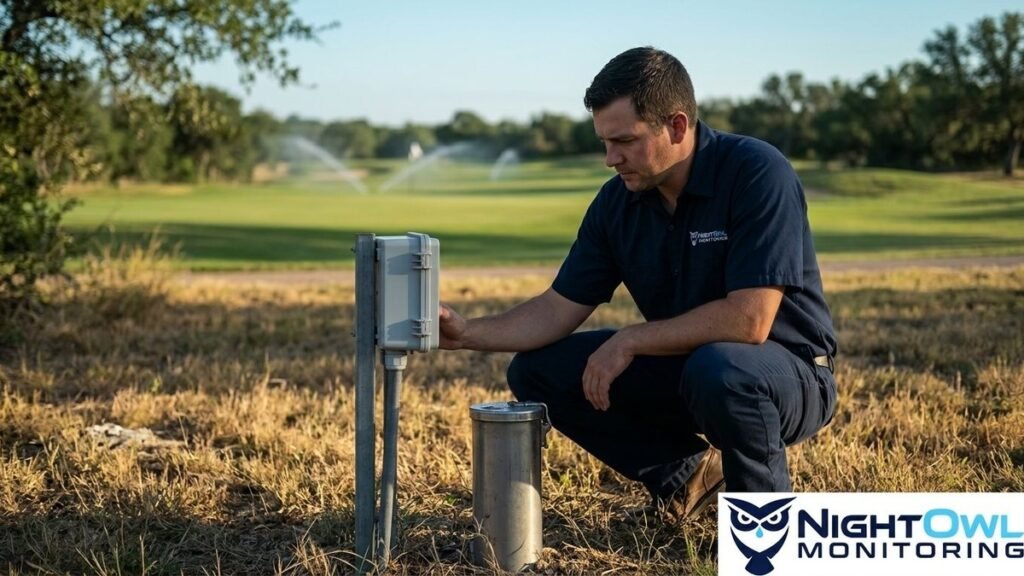
Consider a hypothetical scenario: a new golf course is built and plans to irrigate heavily with groundwater. A large-volume user like this raises immediate questions for a groundwater conservation district about drawdown in the surrounding area:
-
How far will drawdown spread from the production well?
-
How much will the water table drop during peak summer irrigation?
-
How fully does the water level recover between pumping cycles?
-
Are neighboring wells being affected?
A single daily or monthly reading will not answer these questions. It cannot show the stress placed on the aquifer during heavy irrigation hours. Frequent, detailed readings are required to understand the local impact of a project this size.
Why Hourly Monitoring Well Data Matters
“If the district has a monitoring well near the production well and can monitor the water level every hour, they will gather much more information about the effects on the water table of that well.” ~ Jim Blair, NightOwl Monitoring Co-founder
Frequent readings show the cone of depression as it forms and recovers during the pump cycle. Isolated monthly measurements leave large blind spots, while hourly data points show the path of well interference. As noted by experts at the National Ground Water Association, tracking these changes in water level is critical for effective groundwater management and for protecting neighboring permit holders.
NightOwl Monitoring measures water level every hour and uploads that monitoring well data through the cloud. The result is a running timeline of how the aquifer responds to nearby pumping. General managers and hydrogeologists can review it to check whether the golf course is operating within expected parameters, without sending staff into the field.
Combining Flow Data with Water Levels
The drop in water level is only half the equation when evaluating a large irrigation user. The next step is tracking the production well itself to see what is driving the change.
“If the district had water flow data in addition to the water level, then they could get another piece of the puzzle.” ~ Jim Blair, NightOwl Monitoring Co-founder
Pairing the volume of water removed with the drop in the nearby observation well connects cause and effect. Hydrogeologists can see how much pumping leads to each foot of drawdown.
“Anyone can install a bigger or better pump, but it takes art to work with the production that the aquifer gives you.” ~ Jim Blair, NightOwl Monitoring Co-founder
With flow rates alongside hourly level readings, districts can see how the formation responds to pumping over a full season. The same approach supports remote irrigation monitoring, showing whether a user’s pumping is sustainable for the region over the long term. Permit enforcement moves from estimates to verifiable numbers.
Getting this data used to mean piecing together separate systems. Today, districts can watch wells across a wide territory in one place and spot sustainable aquifer management trends before small issues become severe ones.
What Districts Should Track Near a New High-Capacity Well
-
Hourly water level in a monitoring well near the production well.
-
Flow from the production well itself.
-
Drawdown during peak summer irrigation hours.
-
Recovery after the pump shuts off.
-
Total gallons pumped compared with recovery over the season.
The Bottom Line
An aquifer cannot be replaced, so the only realistic strategy is to watch it closely. Hourly water level readings paired with flow data give a district the numbers it needs to make permit decisions that hold up. See live sample data at https://nightowlmonitoring.com/#demo-dashboard.
Frequently Asked Questions
What is monitoring well data?
Monitoring well data is a record of water level readings from a well used for observation rather than production. When the monitoring well sits near a pumping well, its readings show how the water table responds to that pumping.
How often should water levels be measured near a high-capacity well?
Hourly. Monthly or daily readings miss the pump cycle, so they cannot show how far the water table drops during heavy pumping or how quickly it recovers afterward.
What is a cone of depression?
It is the lowered area of the water table that forms around a pumping well. It deepens while the pump runs and recovers after the pump stops. Hourly monitoring well data shows both.
Why does a district need flow data as well as water levels?
Water level shows the effect and flow shows the cause. With both on the same timeline, a district can see how much drawdown a given volume of pumping produces.
Can district staff review the data without visiting the well?
Yes. NightOwl Monitoring uploads water level readings every hour through the cloud, so staff can review them from the office.